Tuning LEMP on a Linode 1536
I've noticed the load increasing on my linode 1536 during the last few weeks, with it now sitting around 0.6 to 1.0 during peak times.
Google analytics show me we're receiving around 20k pageviews to vbulletin and 10k pageviews to wordpress per day.
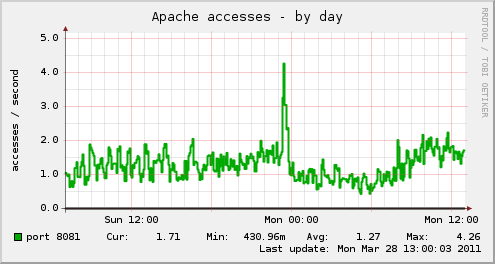
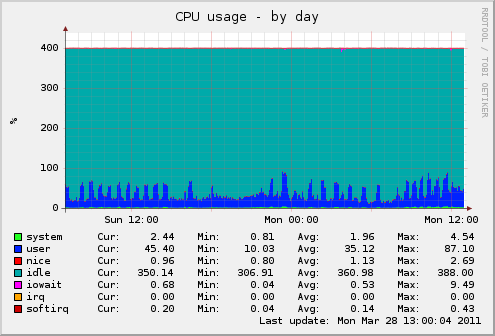
From looking at htop during peak periods I can see Apache is using the bulk of processor grunt during these times - I'm proxying dynamic requests to Apache with nginx.
Note: I restarted Apache a 90 minutes ago hence the low total CPU hours on those processes
top - 13:31:36 up 5 days, 14:02,  2 users,  load average: 0.77, 0.59, 0.51
Tasks: 103 total,   2 running, 101 sleeping,   0 stopped,   0 zombie
Cpu(s):  3.2%us,  0.3%sy,  0.0%ni, 96.5%id,  0.0%wa,  0.0%hi,  0.0%si,  0.0%st
Mem:   1573088k total,  1301180k used,   271908k free,    51964k buffers
Swap:   393208k total,       64k used,   393144k free,   900024k cached

  PID USER      PR  NI  VIRT  RES  SHR S %CPU %MEM    TIME+    TIME COMMAND
 4486 mysql     15   0  272m 167m 4888 S    3 10.9  30:10.77  30:10 mysqld
 2474 root      18   0 44872  17m  824 S    0  1.2   7:23.98   7:23 darkstat
 2495 www-data  15   0  5440 2316  828 S    0  0.1   6:04.50   6:04 nginx
 2499 www-data  15   0  5444 2296  832 S    0  0.1   6:02.12   6:02 nginx
 2498 www-data  15   0  5408 2316  832 S    0  0.1   5:56.11   5:56 nginx
 2497 www-data  15   0  5048 1964  832 S    0  0.1   5:50.03   5:50 nginx
 2587 postfix   15   0  6020 2380 1472 S    0  0.2   3:21.45   3:21 qmgr
 2229 syslog    18   0  1940  684  528 S    0  0.0   0:50.87   0:50 syslogd
30983 www-data  16   0  158m  45m  35m S    8  2.9   0:50.71   0:50 apache2
30982 www-data  21   0  158m  50m  40m S    0  3.3   0:49.60   0:49 apache2
30984 www-data  16   0  157m  56m  47m S    0  3.7   0:40.63   0:40 apache2
30987 www-data  16   0  158m  42m  32m S    0  2.8   0:37.96   0:37 apache2
 2562 root      16   0  5412 1724 1404 S    0  0.1   0:29.19   0:29 master
31034 www-data  16   0  157m  45m  35m S    0  2.9   0:22.87   0:22 apache2
31339 www-data  15   0  159m  44m  34m S    3  2.9   0:16.94   0:16 apache2
  777 root      10  -5     0    0    0 S    0  0.0   0:14.98   0:14 kjournald
  120 root      15   0     0    0    0 S    0  0.0   0:05.86   0:05 pdflush
31489 moses     15   0  7904 1472 1028 S    0  0.1   0:02.53   0:02 sshd
  122 root      10  -5     0    0    0 S    0  0.0   0:02.33   0:02 kswapd0
 2856 root      18   0 23856 4568 1840 S    0  0.3   0:02.25   0:02 fail2ban-server
  121 root      15   0     0    0    0 S    0  0.0   0:02.00   0:02 pdflush
 2709 root      15   0  6912 4976 1568 S    0  0.3   0:01.40   0:01 munin-node
 2250 root      18   0  1880  548  452 S    0  0.0   0:01.02   0:01 dd
16 Replies
 ~~
~~
 ~~
~~
 ~~
~~
 ~~http://www.greenandgoldrugby.com/up/munin/cpu-day.png
~~http://www.greenandgoldrugby.com/up/munin/cpu-day.png
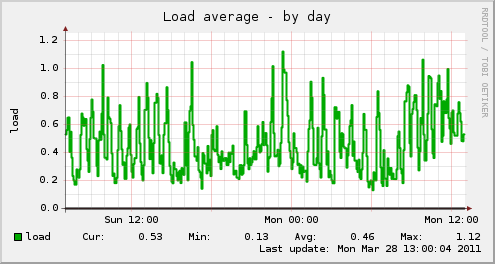 ~~http://www.greenandgoldrugby.com/up/munin/load-day.png
~~http://www.greenandgoldrugby.com/up/munin/load-day.png
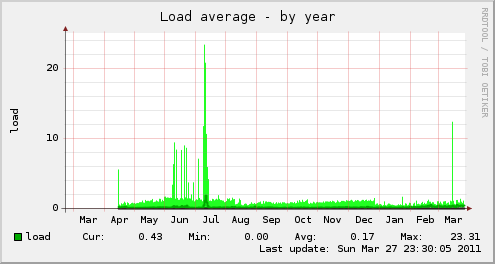 ~~http://www.greenandgoldrugby.com/up/munin/load-year.png
~~http://www.greenandgoldrugby.com/up/munin/load-year.png
 ~~
~~
 ~~
~~
 ~~
~~
 ~~
~~
 ~~
~~
 ~~
~~
 ~~
~~
 ~~
~~
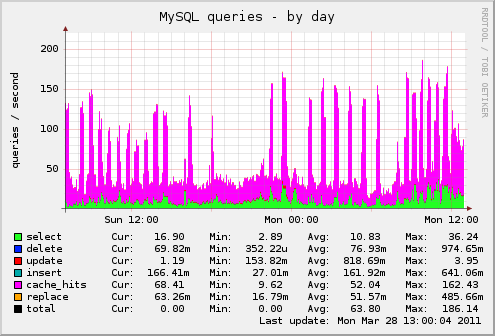
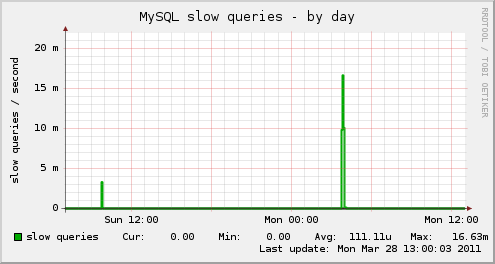
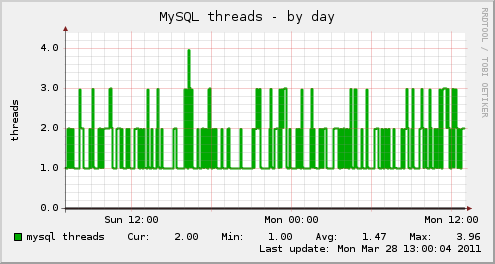
, and adding an optimize table to the nightly crontab.
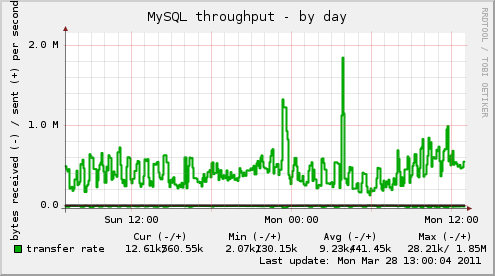
I reckon I am pretty happy with MySQL at the moment, the real pain point seems to be apache.
The majority of load is from vbulletin and wordpress.
$ apache2 -l
Compiled in modules:
  core.c
  mod_log_config.c
  mod_logio.c
  prefork.c
  http_core.c
  mod_so.c
The following modules are enabled:
$ a2dismod
Which module would you like to disable?
Your choices are: alias authz_host autoindex cgi dir env expires headers info mime negotiation php5 rewrite rpaf setenvif status
Following are the relevant lines from my apache2.conf
Timeout 30
KeepAlive On
MaxKeepAliveRequests 50
KeepAliveTimeout 10

# prefork MPM
# StartServers: number of server processes to start
# MinSpareServers: minimum number of server processes which are kept spare
# MaxSpareServers: maximum number of server processes which are kept spare
# MaxClients: maximum number of server processes allowed to start
# MaxRequestsPerChild: maximum number of requests a server process serves
 <ifmodule mpm_prefork_module="">StartServers         3
    MinSpareServers      3
    MaxSpareServers     10
    MaxClients         25
    MaxRequestsPerChild  1000</ifmodule>
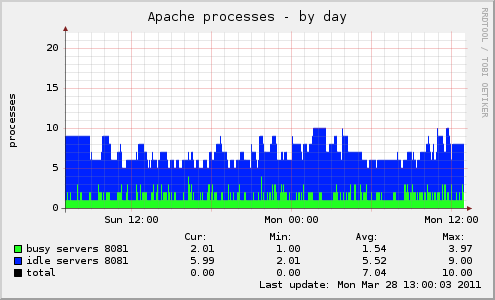
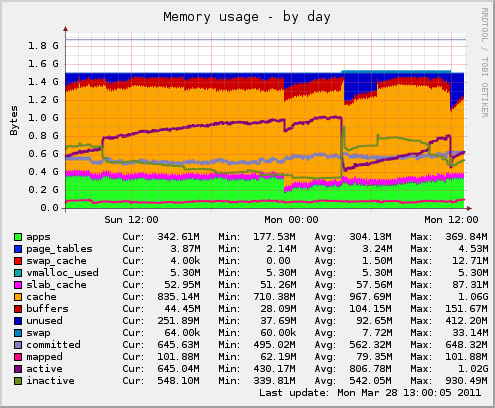
I don't believe that I'm using the 1536MB of allocated RAM to it's fullest and reckon I can throw more processes at Apache to better manage the workload.
In the past when we've approached 1.0 load average we've upgraded to a bigger linode, however this time I'm hoping to tune the existing system.
If required I would think the next step is to buy a second linode and move MySQL off the web server, though I don't think we have the traffic to justify that at this time.
 $ free -m
             total       used       free     shared    buffers     cached
Mem:          1536       1351        184          0         54        917
-/+ buffers/cache:        380       1156
Swap:          383          0        383
I've read good things about worker MPM, would anyone recommend that for my usage? Are there any recommended settings to start with for proxied Apache for similar configurations?
Thanks in advance for any advice,
Moses.
 <ifmodule mpm_prefork_module="">StartServers         10
    MinSpareServers      10
    MaxSpareServers     20
    MaxClients         50
    MaxRequestsPerChild  1000</ifmodule>
@Moses:
Which module would you like to disable?
Your choices are: alias authz_host autoindex cgi dir env expires headers info mime negotiation php5 rewrite rpaf setenvif status
alias autoindex cgi env negotiation
@Moses:
Following are the relevant lines from my apache2.conf
Timeout 30
KeepAlive On
MaxKeepAliveRequests 50
KeepAliveTimeout 10

 <ifmodule mpm_prefork_module="">StartServers         3
    MinSpareServers      3
    MaxSpareServers     10
    MaxClients         25
    MaxRequestsPerChild  1000</ifmodule>
When using nginx you do not need the 'KeepAlive On', turn it Off.
Your apache processes looks very 'fat' (by used memory), but I don't know, why.
APC has useful script apc.php (somewhere in source/shared files) for monitoring RAM usage. You use just little slice of your RAM, so you can give it to APC, if it's necessary.
Really, it looks like your linode is perfectly fine. If you're getting slow page loads, it's not because of a hardware bottleneck.
@OZ, I removed the modules as suggested, upon restarting there was an error related to alias to I stuck that back on and now it's running a bit lighter.
I ran that apc.php script last week and noticed it has used the entire 64MB so I doubled it. Now it's using 93% which seems about right to me.
@JshWright, I'm running wp-supercache for wordpress, it's an excellent plugin. I've also got vBulletin using APC.
@Guspaz, thanks for the honest heads up, perhaps it just feels slow cause of the lag to Australia. That idle average is a good one to keep an eye on. What is a troublesome load figure that I should look out for?
I think the small number of Apache processes may have been a bottleneck, previously it was set to have 3 to 10 processes. Since increasing this value to 10 to 20 processes, and increasing the MaxRequestsPerChild to 5000 the site seems a bit snappier.
Specifically, I'm running ab locally on the linode, is this the correct way?
Test 1: Wordpress
ab -n 5000 -c 200 http://www.greenandgoldrugby.com/index.php
This is ApacheBench, Version 2.0.40-dev <$Revision: 1.146 $> apache-2.0
Copyright 1996 Adam Twiss, Zeus Technology Ltd, http://www.zeustech.net/
Copyright 2006 The Apache Software Foundation, http://www.apache.org/

Server Software:        nginx/0.7.67
Server Hostname:        www.greenandgoldrugby.com
Server Port:            80

Document Path:          /index.php
Document Length:        0 bytes

Concurrency Level:      200
Time taken for tests:   166.936032 seconds
Complete requests:      5000
Failed requests:        4
   (Connect: 0, Length: 4, Exceptions: 0)
Write errors:           0
Non-2xx responses:      4991
Total transferred:      2930466 bytes
HTML transferred:       732 bytes
Requests per second:    29.95 [#/sec] (mean)
Time per request:       6677.441 [ms] (mean)
Time per request:       33.387 [ms] (mean, across all concurrent requests)
Transfer rate:          17.14 [Kbytes/sec] received

Connection Times (ms)
              min  mean[+/-sd] median   max
Connect:        0    0   1.6      0      14
Processing:   163 5952 4896.2   4904   90019
Waiting:      163 5952 4896.2   4904   90018
Total:        163 5952 4896.7   4904   90032

Percentage of the requests served within a certain time (ms)
  50%   4904
  66%   5252
  75%   5569
  80%   5914
  90%   8132
  95%  11745
  98%  18430
  99%  25911
 100%  90032 (longest request)
My observations with htop during the testing window
# requests    Mem Used
Idle        543MB
500 requests    563MB
1000 requests    609MB
1500 requests    693MB
2000 requests    750MB
2500 requests    775MB
3000 requests    777MB
3500 requests    778MB
4000 requests    776MB
4500 requests    774MB
5000 requests    646MB
Test 2: vBulletin
 ab -n 5000 -c 200 http://www.greenandgoldrugby.com/forum/index.php
This is ApacheBench, Version 2.0.40-dev <$Revision: 1.146 $> apache-2.0
Copyright 1996 Adam Twiss, Zeus Technology Ltd, http://www.zeustech.net/
Copyright 2006 The Apache Software Foundation, http://www.apache.org/

Benchmarking www.greenandgoldrugby.com (be patient)
Completed 500 requests
Completed 1000 requests
Completed 1500 requests
Completed 2000 requests
Completed 2500 requests
Completed 3000 requests
Completed 3500 requests
Completed 4000 requests
Completed 4500 requests
Finished 5000 requests

Server Software:        nginx/0.7.67
Server Hostname:        www.greenandgoldrugby.com
Server Port:            80

Document Path:          /forum/index.php
Document Length:        14153 bytes

Concurrency Level:      200
Time taken for tests:   53.260688 seconds
Complete requests:      5000
Failed requests:        0
Write errors:           0
Total transferred:      73275464 bytes
HTML transferred:       70765000 bytes
Requests per second:    93.88 [#/sec] (mean)
Time per request:       2130.428 [ms] (mean)
Time per request:       10.652 [ms] (mean, across all concurrent requests)
Transfer rate:          1343.54 [Kbytes/sec] received

Connection Times (ms)
              min  mean[+/-sd] median   max
Connect:        0    0   2.4      0      20
Processing:    80 1824 1571.1   1423   22346
Waiting:       80 1819 1568.3   1420   22343
Total:         80 1824 1571.5   1423   22346

Percentage of the requests served within a certain time (ms)
  50%   1423
  66%   1538
  75%   1663
  80%   1768
  90%   2154
  95%   4482
  98%   6490
  99%  10339
 100%  22346 (longest request)
Observations with htop during the testing window
# requests    Mem Used
Idle        544MB
500 requests    547MB
1000 requests    562MB
1500 requests    568MB
2000 requests    575MB
2500 requests    658MB
3000 requests    665MB
3500 requests    669MB
4000 requests    674MB
4500 requests    681MB
5000 requests    631MB
Looking at this, I'm amazed at just how much quicker vBulletin is than Wordpress. I'm happy the server can handle this sort of concurrency without breaking a sweat.
Sure the load goes up, but I was able to hapilly browse the site during these tests.
Test 3: Reverted Apache settings to previous
Keepalive On

    StartServers        3
    MinSpareServers     3
    MaxSpareServers     10
    MaxClients        25
    MaxRequestsPerChild  1000
Forum before tweak
 ab -n 5000 -c 200 http://www.greenandgoldrugby.com/forum/index.php
This is ApacheBench, Version 2.0.40-dev <$Revision: 1.146 $> apache-2.0
Copyright 1996 Adam Twiss, Zeus Technology Ltd, http://www.zeustech.net/
Copyright 2006 The Apache Software Foundation, http://www.apache.org/

Benchmarking www.greenandgoldrugby.com (be patient)
Completed 500 requests
Completed 1000 requests
Completed 1500 requests
Completed 2000 requests
Completed 2500 requests
Completed 3000 requests
Completed 3500 requests
Completed 4000 requests
Completed 4500 requests
Finished 5000 requests

Server Software:        nginx/0.7.67
Server Hostname:        www.greenandgoldrugby.com
Server Port:            80

Document Path:          /forum/index.php
Document Length:        72346 bytes

Concurrency Level:      200
Time taken for tests:   159.268260 seconds
Complete requests:      5000
Failed requests:        4849
   (Connect: 0, Length: 4849, Exceptions: 0)
Write errors:           0
Non-2xx responses:      31
Total transferred:      143004459 bytes
HTML transferred:       140505154 bytes
Requests per second:    31.39 [#/sec] (mean)
Time per request:       6370.731 [ms] (mean)
Time per request:       31.854 [ms] (mean, across all concurrent requests)
Transfer rate:          876.84 [Kbytes/sec] received

Connection Times (ms)
              min  mean[+/-sd] median   max
Connect:        0    0   1.1      0      10
Processing:   274 5382 9427.6   1780   90020
Waiting:      270 5375 9424.5   1777   90018
Total:        275 5382 9428.1   1780   90026

Percentage of the requests served within a certain time (ms)
  50%   1780
  66%   3056
  75%   8456
  80%   9190
  90%  10598
  95%  15529
  98%  29768
  99%  53036
 100%  90026 (longest request)
# requests    Mem Used
Idle        445MB
500 requests    561MB
1000 requests    570MB
1500 requests    570MB
2000 requests    571MB
2500 requests    571MB
3000 requests    572MB
3500 requests    577MB
4000 requests    579MB
4500 requests    588MB
5000 requests    490MB
Test 4: Turned off Keepalive, other settings as before
Keepalive On

    StartServers        3
    MinSpareServers     3
    MaxSpareServers     10
    MaxClients        25
    MaxRequestsPerChild  1000
ab -n 5000 -c 200 http://www.greenandgoldrugby.com/forum/index.php
This is ApacheBench, Version 2.0.40-dev <$Revision: 1.146 $> apache-2.0
Copyright 1996 Adam Twiss, Zeus Technology Ltd, http://www.zeustech.net/
Copyright 2006 The Apache Software Foundation, http://www.apache.org/

Benchmarking www.greenandgoldrugby.com (be patient)
Completed 500 requests
Completed 1000 requests
Completed 1500 requests
Completed 2000 requests
Completed 2500 requests
Completed 3000 requests
Completed 3500 requests
Completed 4000 requests
Completed 4500 requests
Finished 5000 requests

Server Software:        nginx/0.7.67
Server Hostname:        www.greenandgoldrugby.com
Server Port:            80

Document Path:          /forum/index.php
Document Length:        14153 bytes

Concurrency Level:      200
Time taken for tests:   50.303879 seconds
Complete requests:      5000
Failed requests:        0
Write errors:           0
Total transferred:      73275000 bytes
HTML transferred:       70765000 bytes
Requests per second:    99.40 [#/sec] (mean)
Time per request:       2012.155 [ms] (mean)
Time per request:       10.061 [ms] (mean, across all concurrent requests)
Transfer rate:          1422.49 [Kbytes/sec] received

Connection Times (ms)
              min  mean[+/-sd] median   max
Connect:        0    0   4.7      0     318
Processing:    37 1841 2148.7   1247   27069
Waiting:       35 1836 2147.0   1242   27068
Total:         37 1841 2149.1   1247   27077

Percentage of the requests served within a certain time (ms)
  50%   1247
  66%   1330
  75%   1409
  80%   1503
  90%   4025
  95%   4538
  98%   9071
  99%  10824
 100%  27077 (longest request)
# requests    Mem Used
Idle        441MB
500 requests    465MB
1000 requests    495MB
1500 requests    526MB
2000 requests    543MB
2500 requests    549MB
3000 requests    548MB
3500 requests    551MB
4000 requests    549MB
4500 requests    556MB
5000 requests    522MB
I think I'm on to something here, Keepalive seems to have been really hindering apache2 when proxied through nginx.
Based on the 99% times, it's roughly 5 times quicker with Keepalive Off!
@Moses:
@Guspaz, thanks for the honest heads up, perhaps it just feels slow cause of the lag to Australia. That idle average is a good one to keep an eye on. What is a troublesome load figure that I should look out for?
"Load average" is better referred to as queue length average. It's the length of the queue of processes to execute. The key thing is, it includes processes currently running. So, a load average of 1 means that you're averaging 1 process running at all times. With 4 cores, 1 is nothing.
@Moses:
I ran that apc.php script last week and noticed it has used the entire 64MB so I doubled it. Now it's using 93% which seems about right to me.
Sorry, but 93% isn't fine. APC works more stable when his memory filled by 50%-70%. If more - cache will be flushed too often.
@Moses:
perhaps it just feels slow cause of the lag to Australia.
Use host-tracker.com to monitor it.
Results for your site:
I remember when you first set up your linode. I thought you went full nginx, no apache.
Why did you change to apache + nginx proxy?
I forgot what OS you were using but php-fpm is baked in to php now. It's great!
Also, running your db on a dedicated linode and nginx/php-fpm on a 512MB allows an easy path to upgrade, horizontally. You just add more 512MB linodes to server memcached only or upstream php-fpm pools. It's really quite nice!
@eyecool:
You just add more 512MB linodes to server memcached only or upstream php-fpm pools. It's really quite nice!
Why spin up whole nodes to add memcached capacity?
The website '
YSlow also complains that your pulling down about 50 different js files and 19 stylesheets. Checking yslow, and firebug's net page will give you a hint at what is slowing down page loads.
Load impact reports a rather sluggish load too, although it handles the 50 client test fine.

